
How to Find a Stock's Real Value: A Pro Shares 5 Tools for Fundamental Analysis
Written by The Inspired Investor Team

Published on November 9, 2021
minute read
Share:


“Remember: price is what you see quoted. Value is what you determine a stock is worth."
That's Brian Donovan's twist on a well-known Warren Buffet-ism, and it's the easiest way to describe his personal investing style. As the founder of StockCalc, a New Brunswick-based fintech company which runs fundamental analysis on stocks and exchange-traded funds (ETFs), the chartered business valuator has spent the better part of a decade asking: what is a stock's value?
Well, what is a stock's value? We asked him what he thinks in an interview. Some companies work hard to shape the narratives they want investors to hear – in the media, during earnings calls, through press releases – to push their stock price up, but “there is much more to investing in a company than just the story it tells," says Donovan. Ultimately, it's up to investors to determine what they think a stock is worth.
Like many fans of fundamental analysis, Donovan believes getting to know a company through its cash flow, debt, future prospects and other fine details gives him a better understanding of a company's true value and can help him identify possible "buy low, sell higher" opportunities. In practical terms, this context helps Donovan answer questions like how much of a return he might expect on an investment, or what price he's comfortable buying in at. (Tip: A great source for fundamental information can be through a stock's detailed quote page.)
There are many fundamental analysis tools out there — ranging from classic fundamental metrics to investors' own personalized techniques — and none are inherently more successful than others. For some investors, a test-and-learn approach can help them find a methodology that works for them. Below, we asked Donovan to share some things he personally takes into consideration when looking for value.
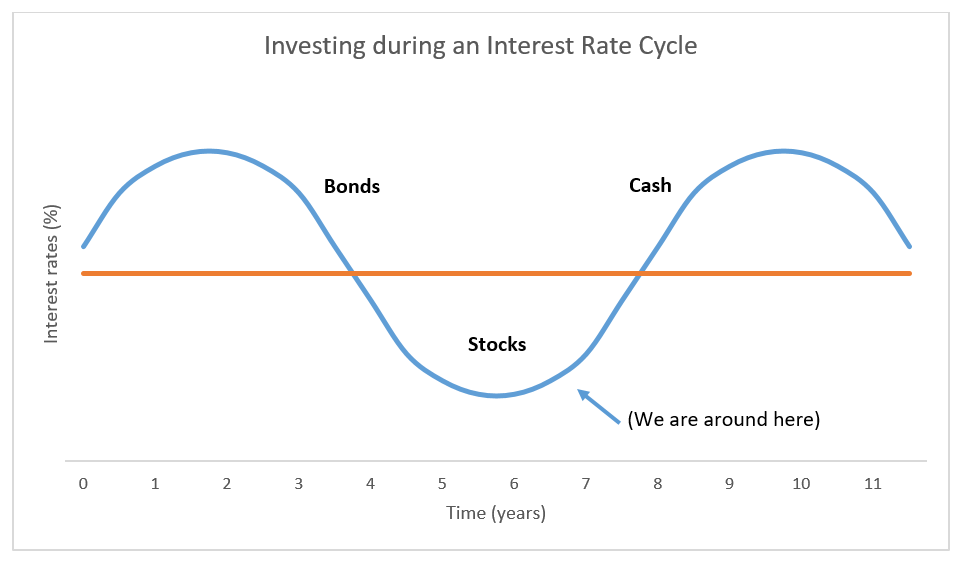
Graph source: Brian Donovan/StockCalc
The economic cycle and interest rates
It can pay to check out the big picture. For one, consider the economic cycle (also known as a business cycle), which Donovan learned about when he first started investing. “This chart has stuck with me for over 30 years and the markets have continued to show its worth," he says. Depending on the stage the economy is in, certain asset classes can perform better – for example, bonds can provide superior returns when interest rates are high and falling, and stocks can be particularly strong buys when interest rates are at their lowest. Donovan adds that “having a balanced portfolio will help you take advantage of the economic cycle over time, with less risk during the ups and downs of the market."
Cash flow (is king)
To Donovan, cash flow is the most important fundamental analysis he undertakes when assessing a company's value. He uses the well-known, but powerful, Discounted Cash Flow equation.
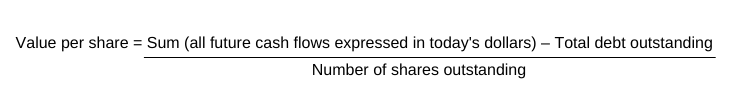
First, Donovan estimates a company's future cash flows, adjusted to today's dollars. It's tricky to do on one's own – yet another reason Donovan created StockCalc – but an internet search can bear out analysts' predictions you can use, or you can work with estimates supplied by the company itself. He then subtracts from that the debt the company owes to calculate its “equity value" – the value of a company available to shareholders. Dividing the equity value by the company's total number of shares nets him a value per share.
Donovan compares this final result (what a company's fundamentals suggest a stock might be valued, or "intrinsic value") to the stock's current price (what people are willing to pay for the stock) to determine if it seems over or undervalued.
Comparables method
When trying to determine if a stock is fairly valued, Donovan suggests the popular textbook method of comparing a company's financials with those of its industry peers. Let's look at the example below.
Say Donovan wants to determine the value of Company A's stock. First, he takes the average price-to-earnings ratios (P/E ratio) of three or more of the company's peers. This offers a broader sense of what a company in the industry earns per share. Then, he multiplies it by Company A's earnings per share (EPS). This tells him what a company would be valued at using peer analysis.
If a company's current stock price is greater than the calculated value, it may be overvalued for its sector. If it is less, it may be undervalued. Company A's stock would be worth $42.08 using this method, implying it is slightly overvalued with a market price at $45.00.
|
Company A |
Data |
Company B |
Company C |
Company D |
Average B, C, D |
|
$45.00 |
Stock price ($) |
$12.00 |
$18.00 |
$30.00 |
$20.00 |
|
$2.25 |
Earnings/Share ($) |
$1.00 |
$0.75 |
$1.50 |
$1.08 |
|
20.0 |
Price/Earnings |
12.0 |
24.0 |
20.0 |
18.7 |
For illustrative purposes only.
Company debt
If a company has too much debt it may not be able to make interest payments in an economic downturn. Conversely, debt can be a very inexpensive way for a company to finance growth through the purchase of machinery, facilities or even a competitor. But, Donovan cautions, low or no debt isn't shorthand for “successful." For example, utilities have high debt levels but they have consistent cash flow, whereas a start-up company still theorizing a product may have none. “There is a right amount of debt for a company to have, and it varies by industry and company," says Donovan.
Dividend1 payouts
Dividends are also an important component to look at. “Companies tend not to pay dividends if there is risk to their cash flow," says Donovan. Paying dividends is often an indicator of company stability, he says, but not always. For example, young, rapidly expanding companies tend not to pay dividends – but they still can create value for shareholders by using the freed-up cash flow to fuel their growth.
Bonus: How to find new stocks
How does an investor find stocks to evaluate in the first place? Donovan uses stock screeners, or curated lists of investment ideas to explore. “Depending on what I am looking for, I may look at all stocks in a single industry (say, all airline stocks during the height of the pandemic), or look for stocks that fit criteria I am interested in," says Donovan. For example, some filters can pull together stocks with low price-to-earnings or price-to-book ratios, or simply stocks that pay a dividend. Using multiple filters, Donovan can typically zero in on stocks with good value once he runs them through his cash flow and comparable models.
Like all investing strategies, fundamental analysis won't always lead to success, but it does put investors in the driver's seat. Applying various methods — with consideration to one's individual goals and risk level — can help an investor determine the right time to buy or sell, or reveal potential opportunities where others may not see them. Ultimately, Donovan concludes, it's about letting investors draw their own conclusions.
RBC Direct Investing Inc. and Royal Bank of Canada are separate corporate entities which are affiliated. RBC Direct Investing Inc. is a wholly owned subsidiary of Royal Bank of Canada and is a Member of the Investment Industry Regulatory Organization of Canada and the Canadian Investor Protection Fund. Royal Bank of Canada and certain of its issuers are related to RBC Direct Investing Inc. RBC Direct Investing Inc. does not provide investment advice or recommendations regarding the purchase or sale of any securities. Investors are responsible for their own investment decisions. RBC Direct Investing is a business name used by RBC Direct Investing Inc. ® / ™ Trademark(s) of Royal Bank of Canada. RBC and Royal Bank are registered trademarks of Royal Bank of Canada. Used under licence.
© Royal Bank of Canada 2021.
1Dividends earned pursuant to DRIP may be subject to requirements imposed by the Income Tax Act (Canada). It is your responsibility to ensure that any associated tax requirements or obligations are satisfied.
Any information, opinions or views provided in this document, including hyperlinks to the RBC Direct Investing Inc. website or the websites of its affiliates or third parties, are for your general information only, and are not intended to provide legal, investment, financial, accounting, tax or other professional advice. While information presented is believed to be factual and current, its accuracy is not guaranteed and it should not be regarded as a complete analysis of the subjects discussed. All expressions of opinion reflect the judgment of the author(s) as of the date of publication and are subject to change. No endorsement of any third parties or their advice, opinions, information, products or services is expressly given or implied by RBC Direct Investing Inc. or its affiliates. You should consult with your advisor before taking any action based upon the information contained in this document.
Furthermore, the products, services and securities referred to in this publication are only available in Canada and other jurisdictions where they may be legally offered for sale. If you are not currently resident of Canada, you should not access the information available on the RBC Direct Investing Inc. website.
Explore More

5 Ways to Get More Out of Your RESP
How can you make the most of this investment vehicle? We explain.
minute read

There's an ETF for That!
Find out more about the options that are out there
minute read

ETF Trends from the RBC Capital Markets Trading Floor – May 2025
Here’s what we saw on the trading floor in May 2025
minute read
Inspired Investor brings you personal stories, timely information and expert insights to empower your investment decisions. Visit About Us to find out more.