
How to use technical analysis research
Having access to detailed, reliable research and analysis can help you make more informed decisions about your portfolio. Here’s how research from Recognia‡, a third-party technical analysis firm, can help you make more informed investment decisions.
Technical vs. fundamental analysis
Historically, investors have relied on two complementary types of analyses: technical and fundamental. With fundamental analysis, investors gather as much information as they can to better understand a company and help determine the value of its stock. For example, an investor using fundamental analysis in their research would examine information such as the company’s financial statements, its products, the market in which it operates, its competitiveness and the management team that guides the business.
Technical analysis, by contrast, is based on analyzing a company’s trading history. The focus is to identify a stock’s past movements and trading volumes in an effort to help predict its future.
Technical analysis from Recognia
With access to technical analysis from Recognia, you can gain a perspective on the market performance and patterns of Canadian and U.S. stocks, exchange-traded funds (ETFs) and indices. This can help you spot investment trends, find new opportunities, validate investment decisions and manage risk. Some features include:
- Featured and most-viewed technical events. You can view featured technical events – a top-rated list of recently formed bullish and bearish events regarding stocks that are poised to make a move – to help you generate potential trading ideas. You can also access a daily list of the most popular bullish and bearish technical events to see what other investors are interested in.
- Educational tools. If you’re new to using automated technical analysis or if you’d like to gain a broader understanding of how to use it to help you choose potential investments, the Technical Analysis Education section features detailed descriptions, characteristics and trading considerations for various chart patterns.
- Chart analysis. To assist clients using a technical analysis approach, chart analysis offers a visual representation (based on patterns) of where a particular stock has been and where it might be headed. For example, “head-and-shoulder top” and “double bottom” are common patterns.
Technical analysis can be a valuable source of information to consider when making a trade or investment decision, especially when used in combination with other forms of research.
1.
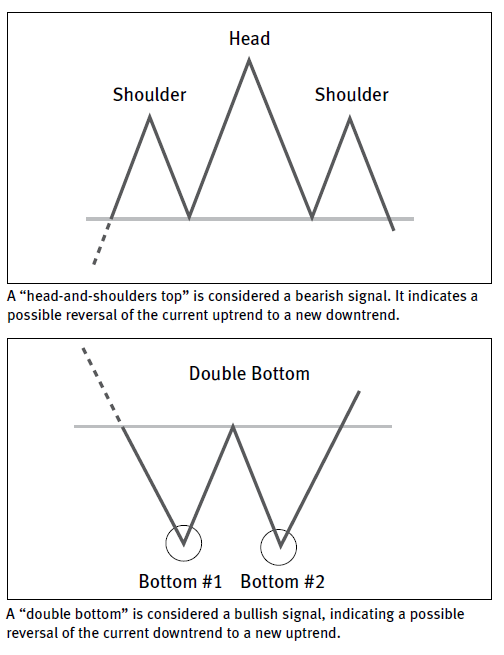
Alt text: head-and-shoulder top chart
The chart is a head–and-shoulders top formation. This pattern is composed of four parts: The left shoulder, the head, the right shoulder and the neckline.
The price of a stock peaks and then falls. This forms the left shoulder.
The price rallies again, higher than the previous peak and then falls settling around the previous low. This forms the head of the formation.
The price rallies to a high for the third time to the same price level as the left shoulder but lower than the head’s peak. The right shoulder is complete when the price comes down from the last high.
The neckline is a line that connects the lows on each side of the head. The formation is complete when the price crosses the neckline after the right shoulder forms.
A head-and-shoulders top is considered a bearish signal, indicating a possible reversal of the current uptrend to a new downtrend.
2.
Alt text: double bottom chart
The chart is a double bottom formation. This formation consists: The first bottom, the second bottom and the breakout.
The price of a stock falls to a low, and then rallies to a peak. The low forms the first bottom.
The price comes down reaching levels of the first bottom, and starts rallying again. This low forms the second bottom. The formation is complete when the price surpasses the level of the previous peak representing the breakout.
A double-bottom is considered a bullish signal, indicating a possible reversal of the current downtrend to a new uptrend.
Find out for yourself—check out the Technical Analysis page now.
You can also get find technical analysis on a specific stock or ETF on a detailed quote.
View Legal Disclaimer
RBC Direct Investing Inc. and Royal Bank of Canada are separate corporate entities which are affiliated. RBC Direct Investing Inc. is a wholly owned subsidiary of Royal Bank of Canada and is a Member of the Investment Industry Regulatory Organization of Canada and the Canadian Investor Protection Fund. Royal Bank of Canada and certain of its issuers are related to RBC Direct Investing Inc. RBC Direct Investing Inc. does not provide investment advice or recommendations regarding the purchase or sale of any securities. Investors are responsible for their own investment decisions. RBC Direct Investing is a business name used by RBC Direct Investing Inc. ® / ™ Trademark(s) of Royal Bank of Canada. RBC and Royal Bank are registered trademarks of Royal Bank of Canada. Used under licence.
© Royal Bank of Canada 2016. All rights reserved.
‡ All other trademarks are the property of their respective owner(s).