
Unlike fundamental analysis, which focuses on the companies that issue stock, technical analysis focuses on the stock market itself. The underlying idea is that the market price already reflects the fundamentals of any given stock, which therefore can be ignored. This approach to stock selection forecasts future price movements and trends based on an examination of past price movements, market activity, prices and volume traded.
Technical analysis relies on a wide variety of charts that analyze price and volume over time. To smooth out short-term fluctuations, these charts are often based on moving averages rather than graphing all the prices a stock may have traded at during the period. A simple moving average is the average of a stock’s closing prices over a given period. It is called a “moving” average because the trading days in the period change for each date being graphed. For example, the average of a stock’s closing prices on the previous five trading days, calculated for each day in January, charts that stock’s five-day moving average in January. An exponential moving average is similar, except that more recent dates are weighted more heavily.
Our technical charts provided by Recognia‡ detect patterns (or formations) and indicators, known as “events,” that suggest price trends and future movements. “Bullish” events are positive, while “bearish” events suggest a decline. Quantitative indicators are often used in conjunction with formations for further evidence of the predicted price movements. Trend following Indicators such as moving averages smooth out price movement to get a sense of the current trend. Momentum indicators measure the speed of price change. An oscillator is a momentum indicator that varies within a range and signals when a stock is “overbought” (high in the range and therefore likely to fall) or “oversold” (low). Some formations and common indicators are discussed in this article, but they are also explained throughout the Technical Analysis section of the website.
Chart Lingo
As you can imagine, technical analysis has its own vocabulary – here are a few basic terms:
- Support level: a level below which the price will likely not fall
- Resistance level: a level above which the price will not likely rise
- Breakout: when a stock rises above its resistance level or falls below its support level
- Trend line: a regression line that predicts future prices based on past prices
- Relative strength: ratio of the percentage price change of a stock to the percentage price change of a broader index, or another stock
Formations
Double Bottom
A double bottom is a bullish chart formation. This happens when prices reach a low point, then rally before dropping to that low point again, without breaking significantly below the support level. The opposite bearish formation is called a double top. Whether it is bullish or bearish, it normally signals a trend reversal rather than a continuation.
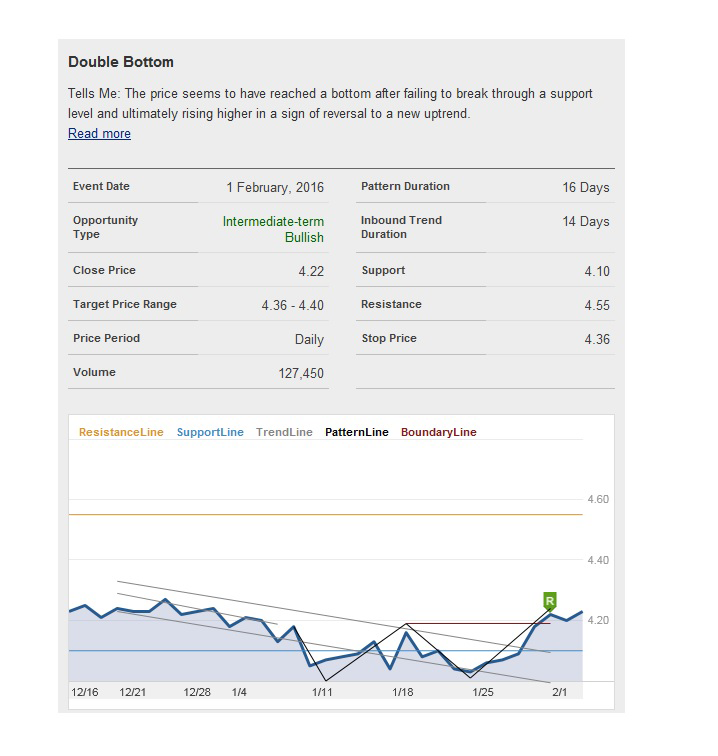
Other chart formations include head-and-shoulders, triangles, and more. Formations can also be found on graphs charted using the “Candlesticks” method. For a detailed explanation of various technical events visit Technical Analysis Education.
Indicators
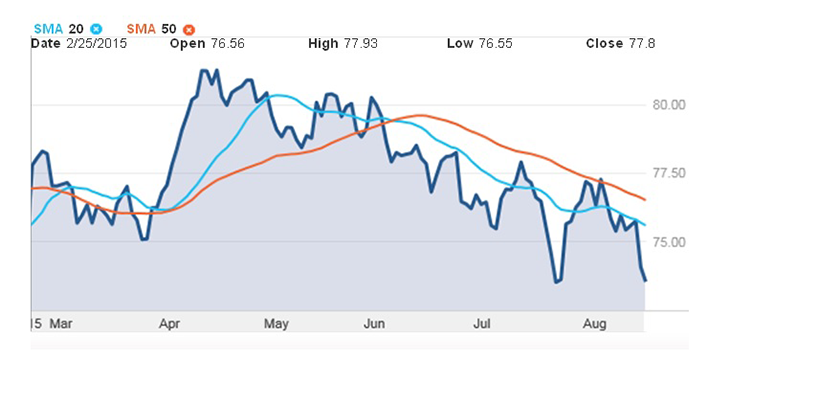
Moving average crosses
The relationship between the 20- and 50-day simple moving averages can be used to identify the medium-term trend. This indicator is bullish when the 20-day moving average crosses above the 50-day moving average and bearish when the 20-day moving average crosses below the 50-day moving average. You can create your own chart combining any two short- and longer-term moving averages. Other popular periods include 5-, 10-, 100- and 200-day moving averages.
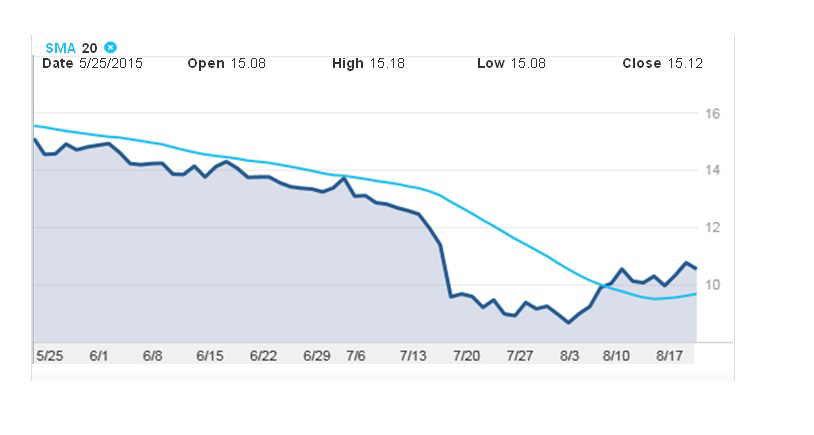
Stock relative to its 20-day simple moving average
The 20-day moving average indicator has its roots in the number of trading days in the average month (21). Thus, it provides a smoothed picture of trading during the last month. This indicator is bullish when the stock crosses above the 20-day average and bearish when it crosses below.
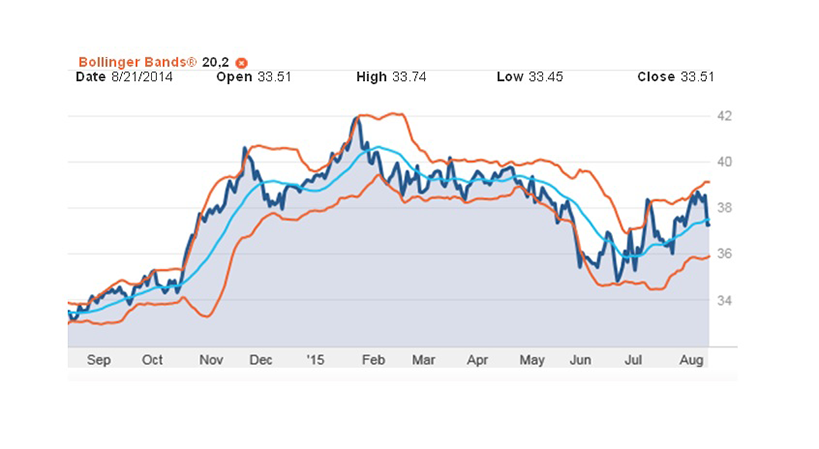
Bollinger bands
Bollinger bands are standard deviation bands plotted around a moving average of the same duration as the standard deviation calculation. Standard deviation is a measure of price volatility. The default parameters are +/- 2 standard deviation bands plotted around a 20-day simple moving average. Here are two of the many ways Bollinger bands can be used:
- Bandwidth: The Bollinger bands expand and contract as volatility increases and decreases. A period when the bands are the tightest they have been in six months is called a “squeeze.” A squeeze typically identifies a consolidating stock that is nearing a breakout, although direction is not specified – it may move up or down.
- Price relative to the bands: The bands can be used as an oscillator. When the last sale is near or above the upper band, the stock is expensive relative to recent price history. When the last sale is near or below the lower band, it is cheap relative to recent price history. This is similar to the overbought/oversold indicators given by other oscillators. However, they are not outright buy or sell indications unless other indicators confirm them. Frequently, price will "walk" up the upper band or down the lower band.
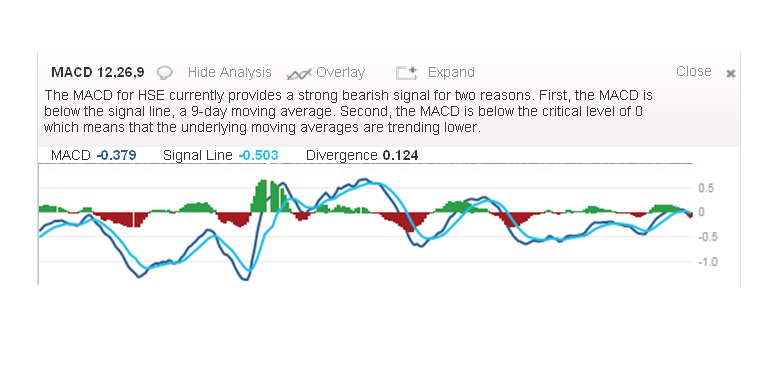
Moving average convergence divergence (MACD)
MACD is an oscillator that provides indications of trend and momentum. It is calculated by taking the difference between a 26-day exponential moving average and a 12-day exponential moving average. When the indicator is above 0, the underlying moving averages are in a bullish position. The reverse is true when the indicator is below 0. A 9-day exponential moving average of the MACD, called the "signal" or "trigger" line, is also plotted. The MACD crossing the signal line is another bullish or bearish indication.
Stochastics
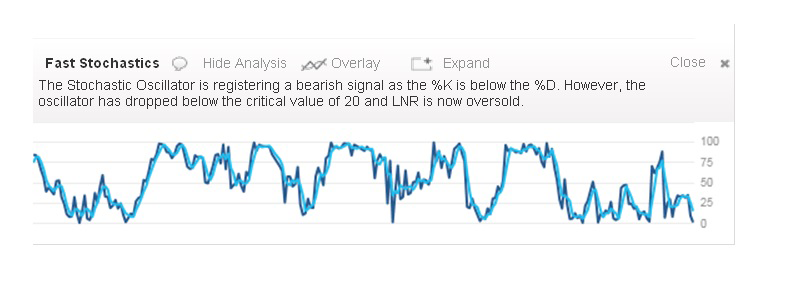
The stochastic oscillator uses two lines, %D and %K, to measure momentum in securities prices. The oscillator appears on the chart in a lower panel and is bounded by 0 and 100. At 0, the current price is at the absolute low for a given period. At 100, the current price is the absolute high for the period. Securities with %K readings above 80 are generally considered overbought, and those with readings below 20 are generally considered oversold.
Investors will frequently buy when the stochastic oscillator moves from oversold to above 20 and sell when the oscillator moves from overbought to below 80. A buy signal is given when the %K crosses over the %D after getting out of oversold territory. The opposite signals a sell.
Relative strength index (RSI)
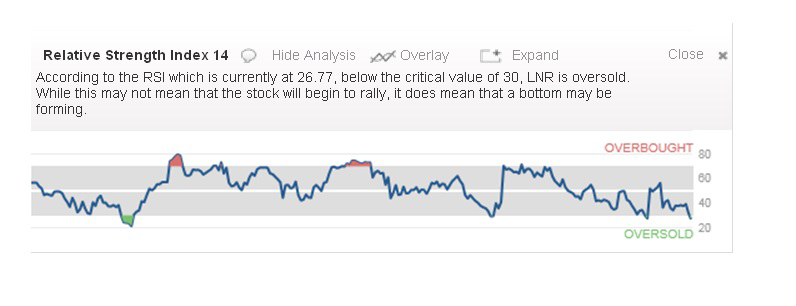
The relative strength index is an oscillator that measures a security's price momentum. This indicator is typically used to identify overbought or oversold markets and divergences, as well as to make patterns clearer. Fourteen periods are normally used in the calculation. Securities with readings above 70 are considered overbought, while those with readings below 30 are considered oversold.
Interested in learning more? The Technical Analysis page in the Research Centre contains a Technical Analysis Education section that explains over 60 different events that may occur. You can get a technical perspective on a stock using a Detailed Quote, or you can check the Technical Analysis page for stocks that have experienced events lately. Alternatively, if you like to perform technical analysis on your own, you can use our charts to draw trend lines, add indicators, customize the view and even save your settings.
RBC Direct Investing Inc. and Royal Bank of Canada are separate corporate entities which are affiliated. RBC Direct Investing Inc. is a wholly owned subsidiary of Royal Bank of Canada and is a Member of the Investment Industry Regulatory Organization of Canada and the Canadian Investor Protection Fund. Royal Bank of Canada and certain of its issuers are related to RBC Direct Investing Inc. RBC Direct Investing Inc. does not provide investment advice or recommendations regarding the purchase or sale of any securities. Investors are responsible for their own investment decisions. RBC Direct Investing is a business name used by RBC Direct Investing Inc. ® / ™ Trademark(s) of Royal Bank of Canada. RBC and Royal Bank are registered trademarks of Royal Bank of Canada. Used under licence. © Royal Bank of Canada 2016. All rights reserved.
‡ All other trademarks are the property of their respective owner(s).