
More Saving, More Spending for Canadians in 2021: RBC Report
Written by Nathan Janzen and Claire Fan

Published on March 3, 2021
minute read
Share:


But debt-wise, they may be less vulnerable than they were pre-COVID.
Key Findings:
- Mortgage debt has surged, but lower rates and higher incomes have made debt servicing more manageable
- Canadians' mix of debt is slightly less interest-rate sensitive than it was pre-COVID
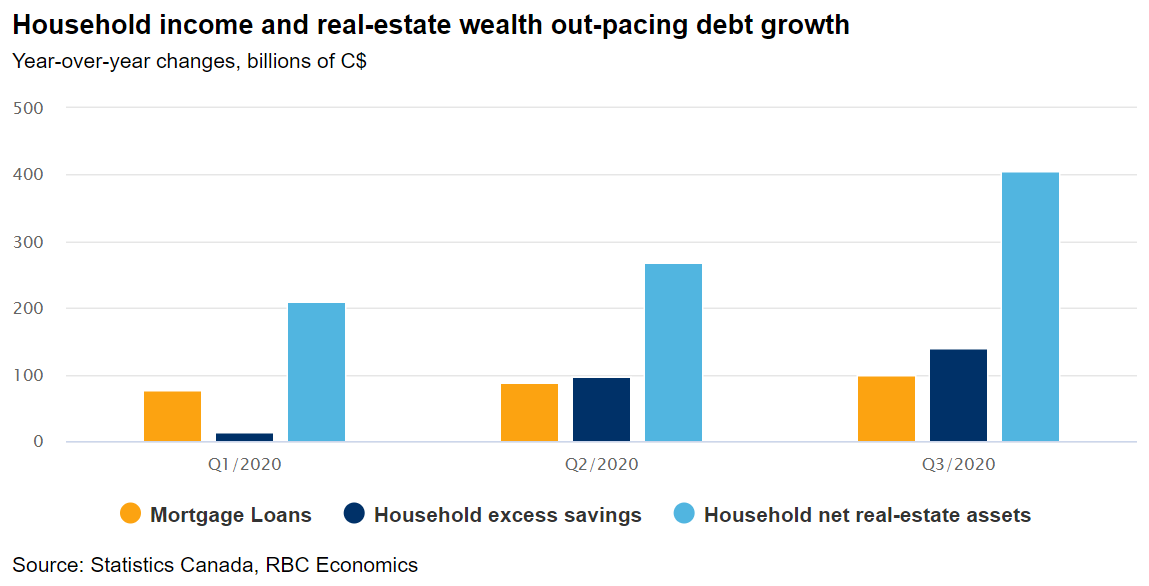
- Household excess savings and real-estate asset values have both increased more than mortgage balances
- The concern remains that there are households caught in the middle
- Pent-up demand and large savings stockpile to boost spending in H2/2021
Household debt levels are rising; debt-servicing concerns are not
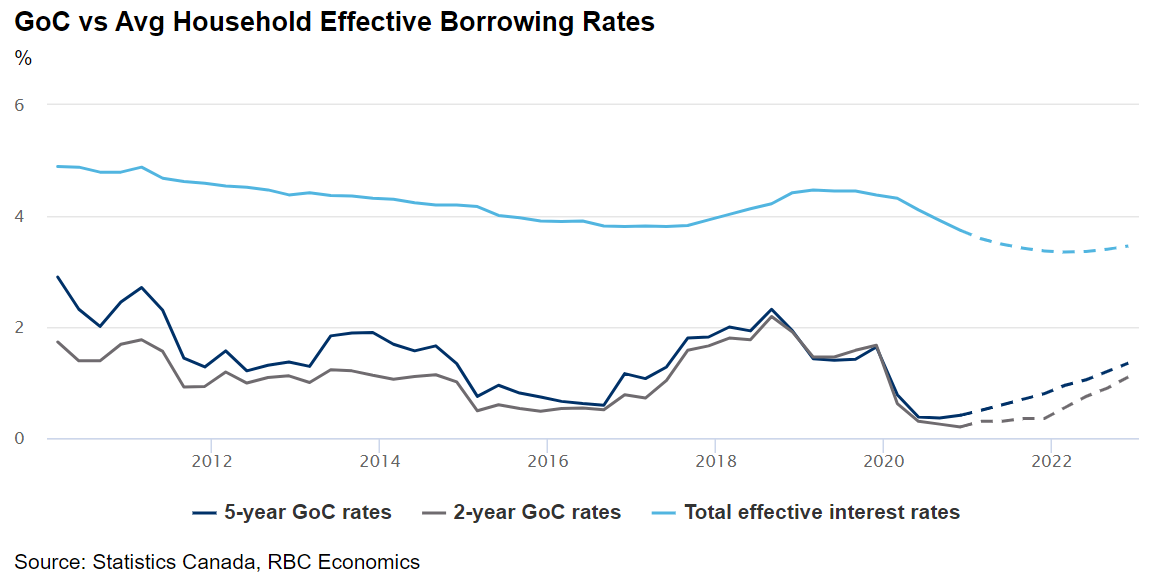
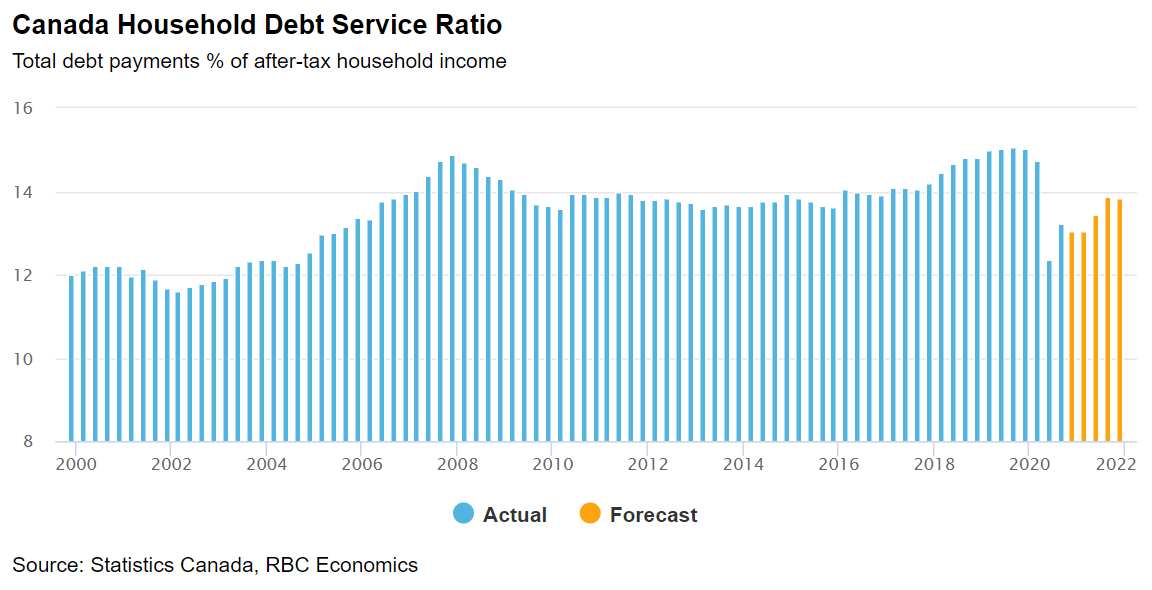
Canadian mortgage debt surged by $118 billion in 2020, almost doubling the increase in the prior year while underscoring a rapid – and remarkable – recovery in Canada's housing market. While overall mortgage debt is higher than pre-COVID levels, the share of household disposable income consumed by debt payments has shrunk. Several factors have made debt servicing more manageable, including lower interest rates, income supports for workers displaced by the pandemic, and payment deferrals for some 3 million borrowers over the summer and fall.
While the deferral programs have largely wound down, the Bank of Canada is committed to keeping interest rates low. Meanwhile, government income supports are likely to be phased out only as labour markets recover. We expect debt payments to remain manageable under these circumstances.
Mix of debt is (slightly) more favourable
Central banks, including the Bank of Canada, have pledged to keep interest rates low for the foreseeable future. And we continue to assume borrowing rates will only gradually drift higher, and remain below pre-shock levels through the end of 2022 in our base case. But with the recovery progressing potentially significantly faster than expected even a few months ago—and massive amounts of fiscal stimulus both in Canada and abroad—interest rates could increase more quickly than foreseen. That would have a larger impact on household debt payments than in decades past, simply because debt levels are higher.
But the mix of Canadians' debt also improved during the pandemic, with a larger share in the form of mortgages that are less sensitive to near-term rate changes. Most of the mortgages in Canada are multi-year contracts. Five-year fixed-rate mortgages accounted for almost half of total mortgages by late last year, up by 7 percentage points from early 2019, according to mortgage lending data from chartered banks. That means it would take time, years in many cases, for higher interest rates to flow through to actual household borrowing costs. Canada's relatively conservative mortgage regulatory regime also bakes in some resilience to rate changes by requiring households to qualify for mortgage loans at (at least) 2% above the actual lending rate. In the meantime, surging house prices mean home asset values have risen faster than debt levels. The net value of household real-estate assets rose $400 billion year-over-year in Q3 2020, more than four times the rise in mortgage debt over the same period.
Outside of mortgages, household debt actually decreased in 2020 as families used some of the large increase in savings accumulated through the shock to (prudently) pay down credit. Credit-card debt, a high-interest item, dropped 14% ($12.8 billion) by the end of December 2020 compared to pre-shock February levels.
The middle may be the worst place to be
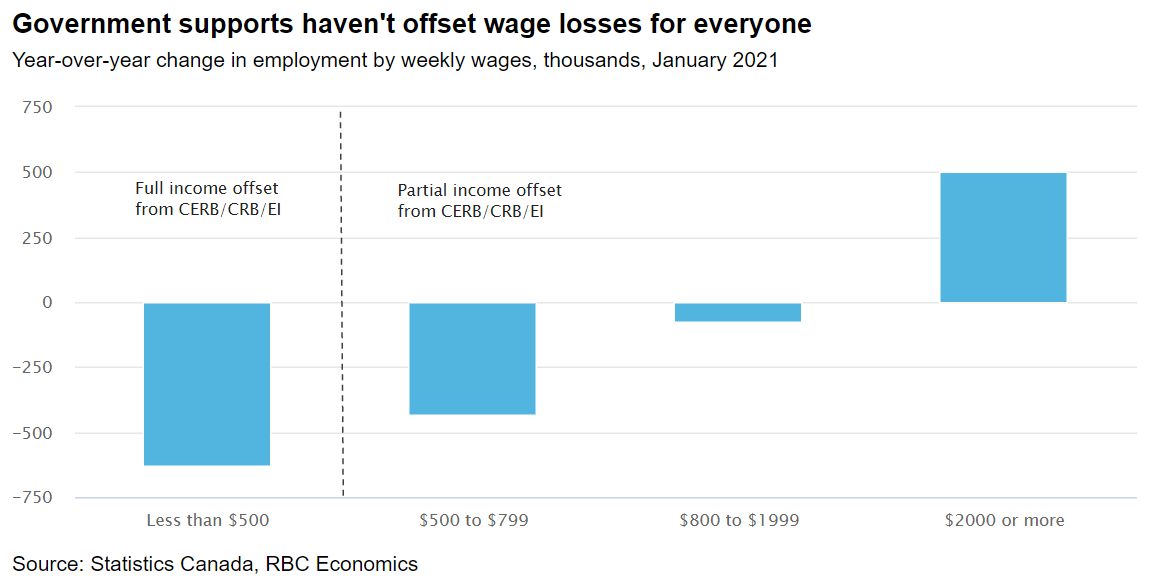
Higher-income households have been much less impacted by job losses during the pandemic. But they are benefiting from the era's low interest rates. These households typically spend more on the kinds of hospitality and travel services that have not been available for purchase, and they likely account for a big share of the growing household savings stockpile. Those at the lowest end of the wage scale, who have experienced more job losses, have seen significant income offsets from government support programs. The concern remains that there are households caught in the middle. Recent Bank of Canada research pointed to an increase in household debt payments relative to incomes largely from middle-income households who lost work and received only partial offset from government support payments.
We expect a rebound in consumer spending later in 2021
The weakness in consumer spending during the pandemic mostly reflects the unavailability of some services. Household spending on goods rebounded very quickly after a collapse last spring—and has remained relatively resilient through the second wave of virus spread/containment measures, as consumers and businesses become more comfortable transacting online. With more vaccines coming and the outlook for an easing of restrictions, household spending could return quite quickly in the second half of 2021, especially for businesses in sectors hardest hit by the pandemic.
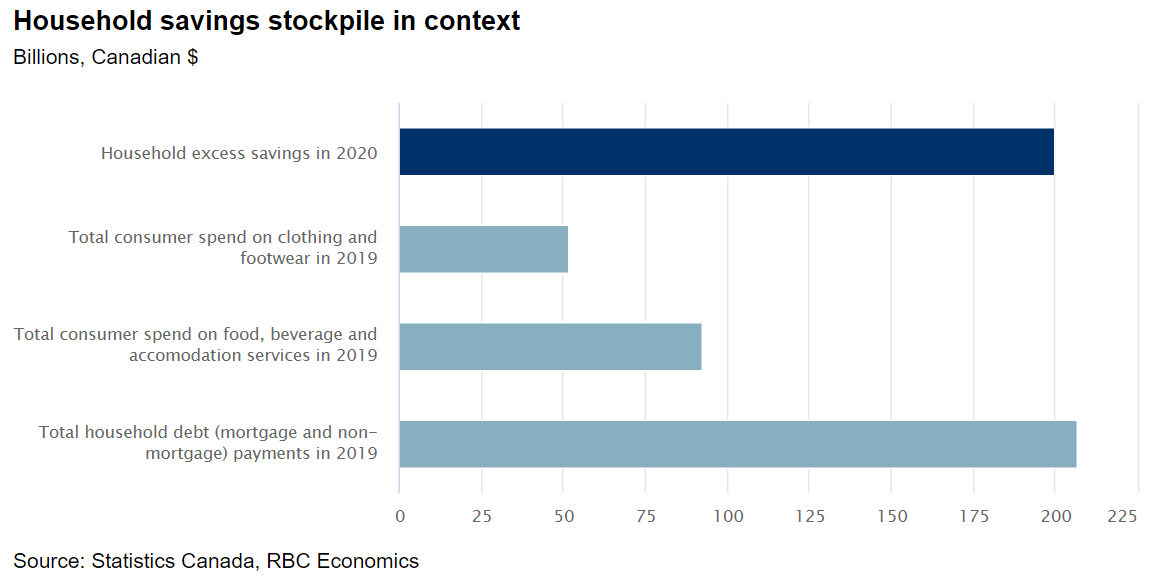
And the savings stockpile that Canadian households, in aggregate, have accumulated over the last year is massive – about $200 billion through 2020 and rising in 2021. For context, that would be the equivalent to 2 years' worth of normal total annual Canadian consumer spending on accommodation & food services, about 4 years of annual spending on clothing, or a little less than a year's total household debt payments. Not all of that will necessarily be spent immediately, but households will have considerable purchasing power once restrictions ease.
This report was authored by senior economist, Nathan Janzen, and economist, Claire Fan.
This article was originally published by RBC Economics on Feb. 19 under the title "Canadians to Borrow and Spend More in 2021."
RBC Direct Investing Inc. and Royal Bank of Canada are separate corporate entities which are affiliated. RBC Direct Investing Inc. is a wholly owned subsidiary of Royal Bank of Canada and is a Member of the Canadian Investment Regulatory Organization and the Canadian Investor Protection Fund. Royal Bank of Canada and certain of its issuers are related to RBC Direct Investing Inc. RBC Direct Investing Inc. does not provide investment advice or recommendations regarding the purchase or sale of any securities. Investors are responsible for their own investment decisions. RBC Direct Investing is a business name used by RBC Direct Investing Inc. ® / ™ Trademark(s) of Royal Bank of Canada. RBC and Royal Bank are registered trademarks of Royal Bank of Canada. Used under licence.
© Royal Bank of Canada 2025.
Any information, opinions or views provided in this document, including hyperlinks to the RBC Direct Investing Inc. website or the websites of its affiliates or third parties, are for your general information only, and are not intended to provide legal, investment, financial, accounting, tax or other professional advice. While information presented is believed to be factual and current, its accuracy is not guaranteed and it should not be regarded as a complete analysis of the subjects discussed. All expressions of opinion reflect the judgment of the author(s) as of the date of publication and are subject to change. No endorsement of any third parties or their advice, opinions, information, products or services is expressly given or implied by RBC Direct Investing Inc. or its affiliates. You should consult with your advisor before taking any action based upon the information contained in this document.
Furthermore, the products, services and securities referred to in this publication are only available in Canada and other jurisdictions where they may be legally offered for sale. Information available on the RBC Direct Investing website is intended for access by residents of Canada only, and should not be accessed from any jurisdiction outside Canada.
Explore More

7 Ways to Get Ahead Financially in 2026
How you might invigorate your finances and put your money to work more intentionally this year
minute read

Economic Outlook: Uncertainty is Here to Stay, So What's Next?
Takeaways from the Economic Club of Canada’s Annual Event
minute read

3 things: Week of December 15
What the Inspired Investor team is watching this week
minute read
Inspired Investor brings you personal stories, timely information and expert insights to empower your investment decisions. Visit About Us to find out more.