Fixed Income: The Basics
Published on July 9, 2020
minute read
Share:
Fixed income products, such as guaranteed investment certificates (GICs), bonds and money market securities, typically generate a predictable stream of interest income and/or promise a future lump sum payment. Adding fixed income products to your portfolio can be a great way to achieve diversification. Mutual funds and exchange-traded funds are another way to gain exposure to fixed income investments.
What are fixed income products?
When you buy a stock, you are buying ownership in a company. But when you buy fixed income, you are lending your money to the issuer. Essentially, a fixed income product is like an IOU given by the issuer to investors. These IOUs can be issued by governments and corporations. In return for lending the money, you get a benefit – most commonly in the form of regular interest payments until the money is repaid. Unlike when you buy stock, you are not entitled to a share of the issuer’s profits as a fixed income investor.
There are many different kinds of fixed income products, though bonds are probably the best known. Bonds generally have a fixed term and promise a semi-annual coupon (interest payment) to the lender.
You may be wondering why a corporation would need to borrow money from ordinary people, or why it wouldn’t simply issue equity to raise money. Corporations do sometimes borrow from banks, but at times large corporations need more capital than a bank can provide. This is when they turn to the markets and investors.
The return you generate from fixed income is taxed differently from return generated from equity. Capital gains and dividends are taxed favourably, while interest earned on fixed income holdings is taxed as income.
Interest income is not the only way a fixed income investment can generate returns, however. The market price of a bond can change over time. If a bond matures at a price that is different from the purchase price, you realize a gain or loss that may be treated as a capital gain or capital loss for tax purposes. This is also true when the bonds are sold before maturity.
Similar bonds will deliver approximately similar yields, even though they might have different coupon rates.
Fixed Income Drivers
“Yield to maturity” is the term for the return provided by a fixed income investment and is calculated assuming the holder does not sell the bond prior to maturity. The yield on a bond is based on both its purchase price and the interest (or coupon) payments it pays each year. The yield is most affected by five key variables, discussed in detail below:
Interest Rates
Interest rates vary from market to market, and change over time in response to government lending rates and market conditions.
Market and benchmark interest rate movements affect fixed income prices significantly. When market interest rates rise, bond prices fall. Conversely, when market interest rates fall, bond prices rise. That is, prices move in the opposite direction of interest rates. The best way to understand the relationship between bond prices and interest rates is to look at an example.
Suppose you purchase a bond with a 5.0% coupon this year. Now imagine that interest rates fall over the course of the year and a similar bond is issued next year with a coupon of 4.0%. The bond issue you own is now more attractive because you are receiving a higher coupon payment than an investor who purchases the bond issued this year. Because the 5.0% coupon bond pays interest greater than the market rate, your bond’s price will increase.
In this way, similar bonds will deliver approximately similar yields, even though they might have different coupon rates. This is illustrated by the following table.
|
Bond Price |
Coupon |
Yield to Maturity |
|---|---|---|
|
$99 (trading at a discount) |
3.5% |
4% |
|
$100 (trading at par) |
4% |
4% |
|
$101 (trading at a premium) |
4.5% |
4% |
Maturity
A fixed income maturity date refers to the specific date on which the investor’s principal will be repaid. Most bond maturities range from one day to 30 years. Bonds that mature within five years are usually called “short-term,” while bonds that mature after 10 years or more are called “long-term.” GIC terms usually range from one to five years. Money market products mature in less than a year.
Products with a longer maturity often (in a normal yield curve environment, discussed below) deliver a higher yield than products with shorter maturities. That’s because holding a product with a long maturity generally exposes you to more risk.
Duration
The duration of a fixed income investment, expressed as a number of years, tells you how sensitive its price will be to changes in the market or benchmark interest rates. A higher duration means greater price sensitivity. Duration is calculated from a number of factors including the present value, the coupon rate, the maturity and any special features.
| Duration | Price sensitivity to a change in rate is... | If market interest rates fall the prices of the bond will go... | The impact of rising interest rates on price will be... | If market interest rates rise the price of the bond will go... | The impact of falling interest rates on price will be... |
| High | High | Up | More | Down | More |
| Low | Low | Up | Less | Down | Less |
A longer maturity results in a higher duration while a higher coupon payment lowers duration. Bonds with long maturities and low coupon rates (or no coupon) will have the highest durations. Bonds with shorter maturities and high coupon rates will have the lowest durations.
If you suspect that interest rates are going to fall, you might choose to create a bond portfolio with a higher average duration or adjust your current holdings to increase portfolio duration. The increased price sensitivity would mean that the value of your portfolio would increase more rapidly as rates fell.
Conversely, if interest rates are already low and you are concerned that they will rise in the near future, you might choose to create a portfolio with a lower average duration or make changes to your existing portfolio to reduce overall duration.
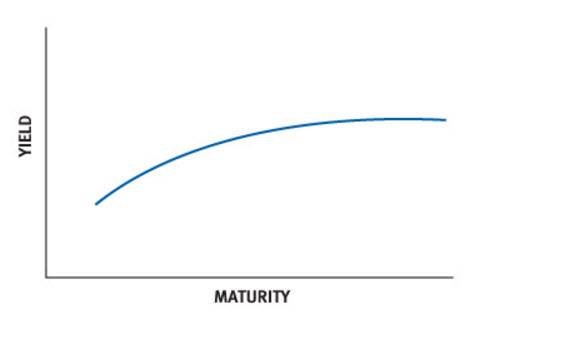
The yield curve graphs the relationship between interest rates and different maturities. It is used as a benchmark for debt in the market.
Credit Rating
Many fixed income products are rated by independent rating agencies that measure the issuer's creditworthiness or ability to make interest payments and repay principal.
The two major bond-rating agencies in Canada are the Dominion Bond Rating Service (DBRS) and Standard and Poor's (S&P). In the U.S., the two major rating agencies are S&P and Moody's. A downgrade can cause the market price of a bond to fall; similarly an upgrade may cause the price to increase.
Demand for higher rated bonds is greater than for riskier bonds. This is in part due to the requirements of certain institutional investors such as pension funds and insurance companies to hold nothing but or mostly “investment grade” bonds in their portfolio. A bond is deemed to be investment grade if it is of relatively low risk of default and holds a credit rating above a certain threshold. The table below indicates the necessary rating by agency to qualify as such.
|
Bond Rating | ||||
|---|---|---|---|---|
|
DBRS |
Moody's |
S&P |
Grade |
Risk |
|
AAA |
Aaa |
AAA |
Investment |
Lowest Risk |
|
AA |
Aa |
AA |
Investment |
Low Risk |
|
A |
A |
A |
Investment |
Low Risk |
|
BBB |
Baa |
BBB, BBB- |
Investment |
Medium Risk |
|
BB, B |
Ba, B |
BB+, BB, B |
Junk |
High Risk |
|
CCC/CC/C |
Caa/Ca |
CCC/CC/C |
Junk |
Highest Risk |
|
D |
C |
D |
Junk |
In Default |
Special Features
Certain fixed income products have structures that can change the life, yield and payoff of the investment. For instance, “call” features expose investors to the risk of early redemption and subsequent reinvestment risk. Some bonds have a "put" feature, which allows the investor to demand early repayment of principal or another specified amount at specified times prior to maturity. These special features impact the price of a bond, depending on who the feature benefits. In the case of a callable bond, since this favors the issuer, the bond price will be lower than the same bond without the feature. For a puttable bond, since the bondholder benefits from the feature, it will cost more than the same bond without the put feature.
There are a number of other special features that may be embedded in a bond. As an investor, you should understand which type of bond is best suited for your investment objective and tolerance for risk.
The Yield Curve
The yield curve graphs the relationship between interest rates and different maturities. It is used as a benchmark for debt in the market. In theory, the shape of the yield curve gives an idea of investors’ expectations of the future interest rate direction.

The three main types of yield curves are normal, flat and inverted. The normal yield curve is upwards-sloping because long-term bonds are more risky than short-term bonds and investors expect to be compensated with higher yields. In a flat yield curve, short- and long-term yields are essentially the same, which may signal a transitional phase in the economy. An inverted yield curve is one in which short-term rates are higher than long-term rates. In this case, investors may be anticipating future interest rate cuts, so long-term rates are lower. This type of curve often implies an impending recession.
Fixed Income Markets
No two bond issues are exactly alike, and the number of different securities outstanding is substantial. For this reason, fixed income markets are substantially larger than equity markets. Unlike the stock markets, bond markets generally remain decentralized and do not trade on common exchanges. Decentralized markets are known as over-the-counter (OTC) markets.
In an OTC market, dealers carry inventories of securities, such as debt securities or derivatives, in order to facilitate the buy and sell orders of investors, rather than providing the order matchmaking service between buyers and sellers seen in stock exchanges. Deals are transacted over the phone or through electronic systems.
When you perform a search for fixed income products using the Fixed Income Screener, you are searching through inventory held by RBC.
Laddered Portfolio
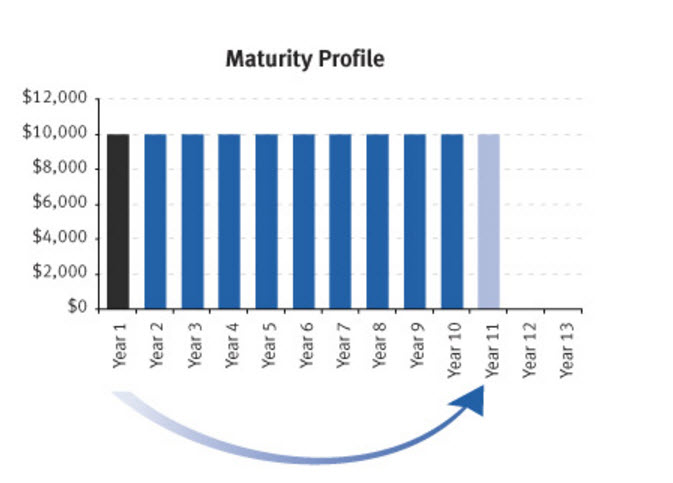
A laddered portfolio is composed of several fixed income products with successively longer terms to maturity. For instance, in a 10-year laddered portfolio, you might start by purchasing 10 bonds that mature in each of the next 10 years. When the first bond matures at the end of year one, you would reinvest in a bond that matures in ten years – and continue doing this every year.
Each position in a laddered portfolio is usually the same size as the next, with roughly equal intervals between maturity dates. You can create a laddered portfolio using bonds or GICs.

A laddered portfolio helps spread your reinvestment risk over the long term, helping to average out the effects of overall interest rate changes. For instance, if you only purchase bonds with short-term maturities you will have relatively stable bonds with lower returns. Conversely, bonds with longer-term maturities are more sensitive to changes in interest rates, but offer higher yields in a normal yield curve environment.
A laddered portfolio diversifies your exposure to the yield curve. You realize greater returns than from holding only short-term bonds, but with lower risk than holding only long-term bonds. Moreover, by spreading out the maturities of your portfolio, you reduce the effects of interest rate changes.
RBC Direct Investing Inc. and Royal Bank of Canada are separate corporate entities which are affiliated. RBC Direct Investing Inc. is a wholly owned subsidiary of Royal Bank of Canada and is a Member of the Canadian Investment Regulatory Organization and the Canadian Investor Protection Fund. Royal Bank of Canada and certain of its issuers are related to RBC Direct Investing Inc. RBC Direct Investing Inc. does not provide investment advice or recommendations regarding the purchase or sale of any securities. Investors are responsible for their own investment decisions. RBC Direct Investing is a business name used by RBC Direct Investing Inc. ® / ™ Trademark(s) of Royal Bank of Canada. RBC and Royal Bank are registered trademarks of Royal Bank of Canada. Used under licence.
© Royal Bank of Canada 2025.
Any information, opinions or views provided in this document, including hyperlinks to the RBC Direct Investing Inc. website or the websites of its affiliates or third parties, are for your general information only, and are not intended to provide legal, investment, financial, accounting, tax or other professional advice. While information presented is believed to be factual and current, its accuracy is not guaranteed and it should not be regarded as a complete analysis of the subjects discussed. All expressions of opinion reflect the judgment of the author(s) as of the date of publication and are subject to change. No endorsement of any third parties or their advice, opinions, information, products or services is expressly given or implied by RBC Direct Investing Inc. or its affiliates. You should consult with your advisor before taking any action based upon the information contained in this document.
Furthermore, the products, services and securities referred to in this publication are only available in Canada and other jurisdictions where they may be legally offered for sale. Information available on the RBC Direct Investing website is intended for access by residents of Canada only, and should not be accessed from any jurisdiction outside Canada.
Inspired Investor brings you personal stories, timely information and expert insights to empower your investment decisions. Visit About Us to find out more.


