
Make the Trading Dashboard Your Own — What's Your Style?
Written by The Inspired Investor Team

Published on June 10, 2021
minute read
Share:


The new RBC Direct Investing Trading Dashboard allows you to customize the information you display to meet your needs. It's like a blank canvas that you can build out using widgets, and change whenever you like. Here's a taste of the possibilities: You can easily add up to 20 data fields in list widgets – including things like net percentage change, currency and market value – and you can customize the way information is displayed as well. The best part? Your Dashboard allows you to create five different work spaces to suit your needs and preferences. Watch our video to learn more.
To help you with ideas on how to set up your own dashboard, we've put together a few sample views* for inspiration.
The Classic – Plus
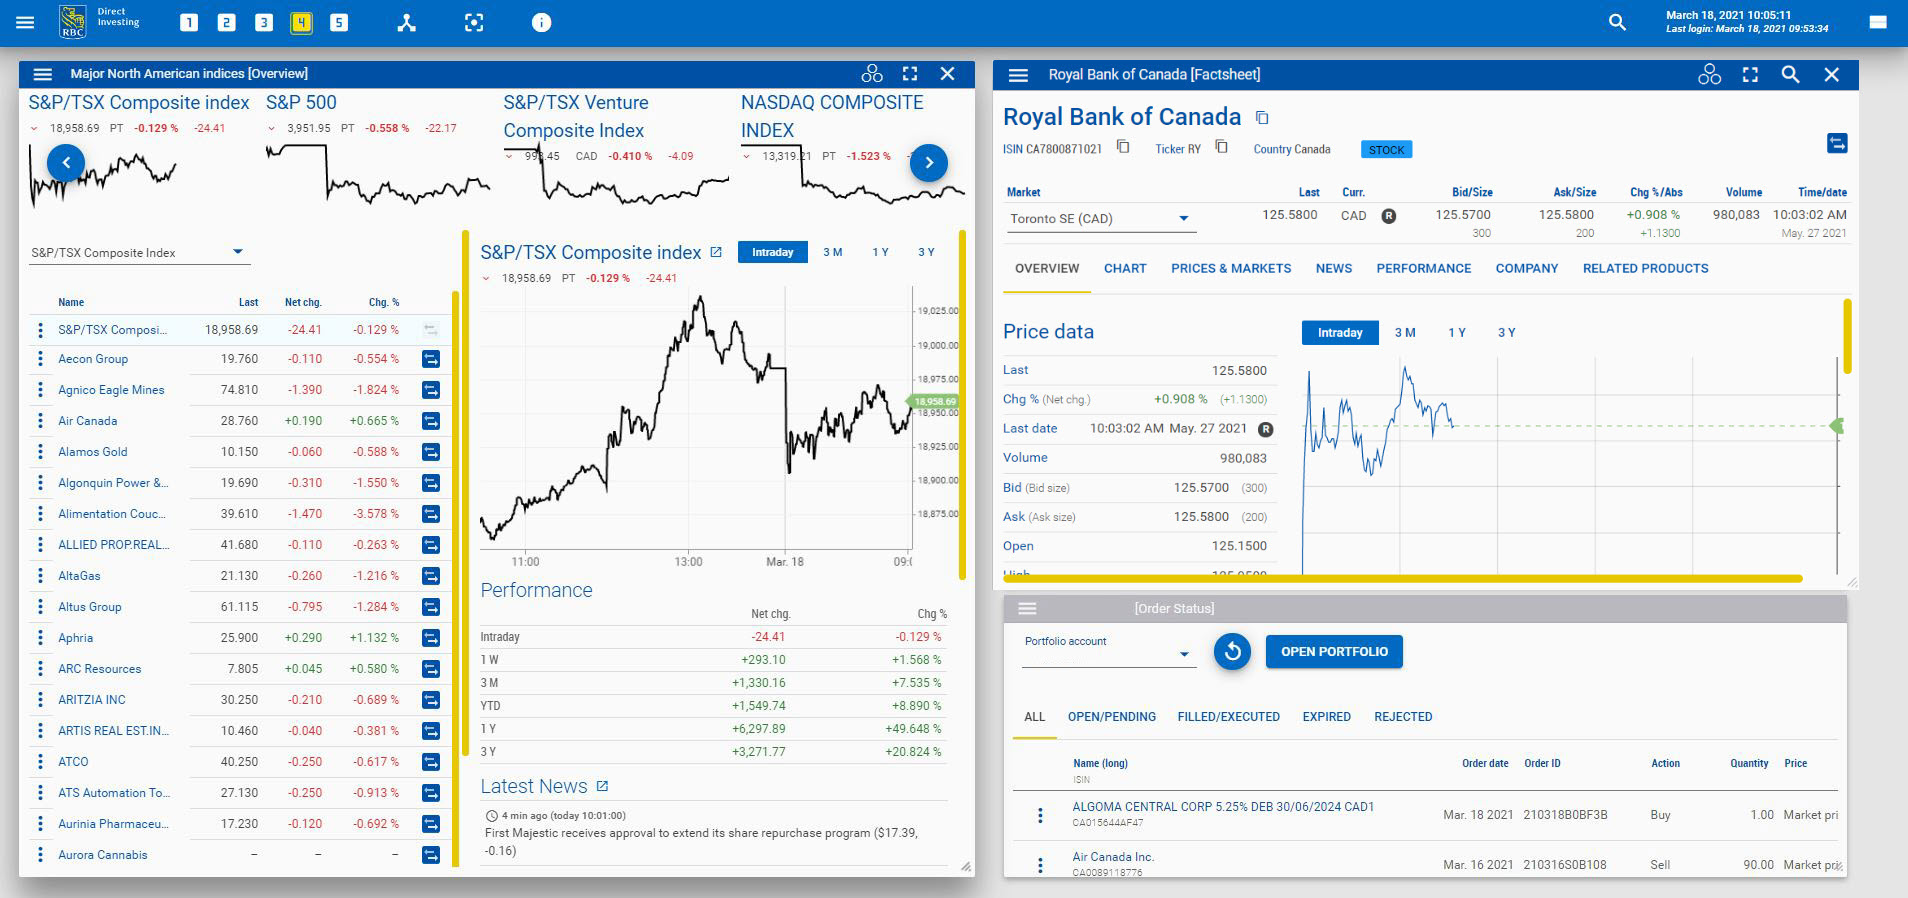
The epitome of "new and improved," this view might appeal to the investor who likes to keep things simple and straightforward, but with a bonus. There are familiar elements here, such as a Factsheet — which provides detailed quote information — and order status, but you'll also see the North American Overview widget. An investor using this view might be seeking opportunities in North American indices and could sort the composite securities by percentage change to spot ideas.
Technical Analysis Lab

Charts: some investors can't get enough of them. At the top left corner in this instance, a line chart would allow an investor to do a deep dive on an ETF. In the bottom panel, the candle chart offers up data from the Bollinger Band and MACD studies. Finally, at top right, the order book is open for quick access to Level 2 quotes.
Watchlist Special
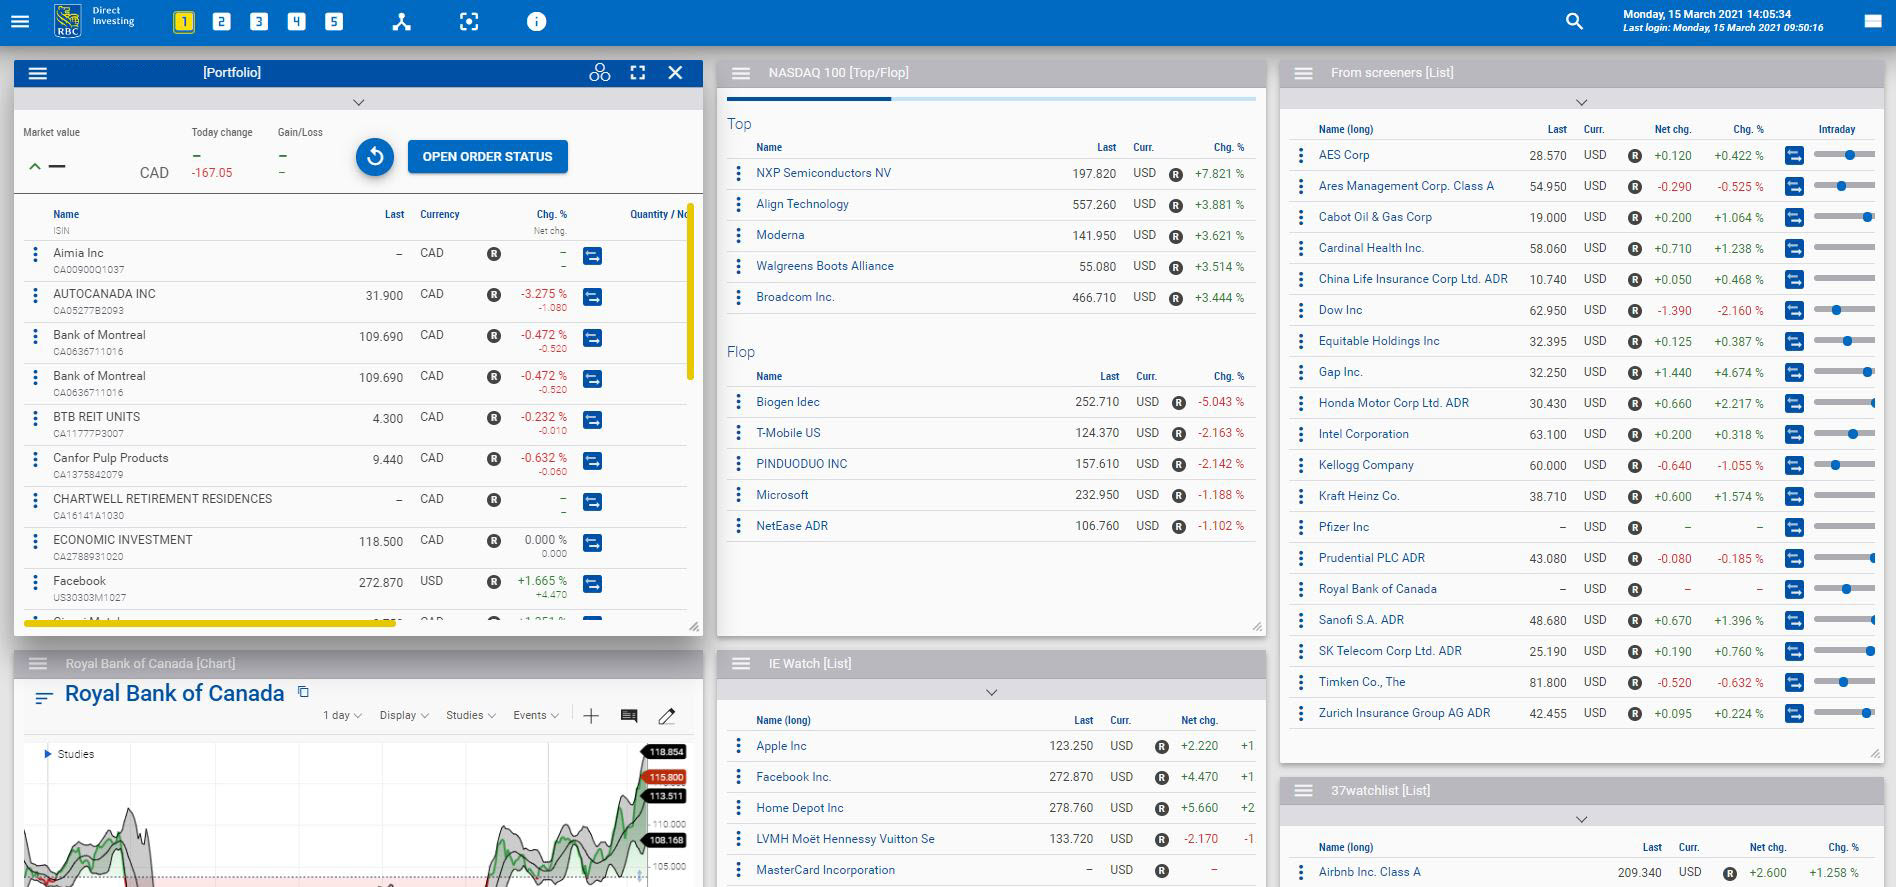
Nothing gets by this hawk-eyed investor! An investor using this setup is not one to miss an opportunity to buy or sell — and likely has a watchlist for every occasion. An investor can view his or her portfolio here, and can also view four watchlists on one screen. In this configuration, there's also a "Top/Flop" view of the Nasdaq 100, which shows the top five performers within the Nasdaq 100 for the day and the bottom five "flops".
I SPY Options

This view could be helpful for an options trader interested in SPY calls. On the left side, there's a SPY FactSheet open to review its historical performance and any related news. In the middle is the SPY Options chain, and on the right is a quote on an individual option within the Option FactSheet. Find out more about options in the Options Trading Guide.
Try it!
What's your style? Did you find any ideas or inspiration in the examples above? The best way to figure out how the Dashboard will best work for you is to start experimenting. Add panels and widgets you think you'll find useful, and pull them back out if they prove otherwise. Play around with it – that's part of the fun. Access the Dashboard under My Portfolio or Place an Order, and find out more in How to Use the New Trading Dashboard.
*All of the Dashboard views included are for illustrative purposes only and are not meant as recommendations of any specific security or investing approach.
RBC Direct Investing Inc. and Royal Bank of Canada are separate corporate entities which are affiliated. RBC Direct Investing Inc. is a wholly owned subsidiary of Royal Bank of Canada and is a Member of the Investment Industry Regulatory Organization of Canada and the Canadian Investor Protection Fund. Royal Bank of Canada and certain of its issuers are related to RBC Direct Investing Inc. RBC Direct Investing Inc. does not provide investment advice or recommendations regarding the purchase or sale of any securities. Investors are responsible for their own investment decisions. RBC Direct Investing is a business name used by RBC Direct Investing Inc. ® / ™ Trademark(s) of Royal Bank of Canada. RBC and Royal Bank are registered trademarks of Royal Bank of Canada. Used under licence.
© Royal Bank of Canada 2021.
Images presented in the image are for illustrative purposes and may not represent the actual web pages within the RBC Direct Investing online investing site.
The views and opinions expressed in this publication are for your general interest and do not necessarily reflect the views and opinions of RBC Direct Investing. Furthermore, the products, services and securities referred to in this publication are only available in Canada and other jurisdictions where they may be legally offered for sale. If you are not currently resident of Canada, you should not access the information available on the RBC Direct Investing website.
Explore More

5 Ways to Get More Out of Your RESP
How can you make the most of this investment vehicle? We explain.
minute read

There's an ETF for That!
Find out more about the options that are out there
minute read

ETF Trends from the RBC Capital Markets Trading Floor – May 2025
Here’s what we saw on the trading floor in May 2025
minute read
Inspired Investor brings you personal stories, timely information and expert insights to empower your investment decisions. Visit About Us to find out more.