
A Time Machine for Investing? Sign Me Up
Written by The Inspired Investor Team

Published on July 26, 2023
minute read
Share:


This article was published with files from RBC Global Asset Management.
As investors, it's pretty common to wish for a crystal ball that can show us where markets are headed. But what about a time machine? And, specifically, one that could take you back to the perfect time to invest?
OK, full disclosure… we don't have one. But we recently heard about a way to put market uncertainty into perspective, which can help us keep our emotions in check when it comes to making investing decisions. This thought exercise comes courtesy of RBC Global Asset Management (RBC GAM), and we think it's a great one to share. Jump into our, ahem, Delorean, and we'll explain.
The question posed was this: If you had a time machine and cash to invest, what time period would you return to in the markets? Before you decide, check out this history of U.S. bull and bear markets.
A history of U.S. equity bear and bull markets
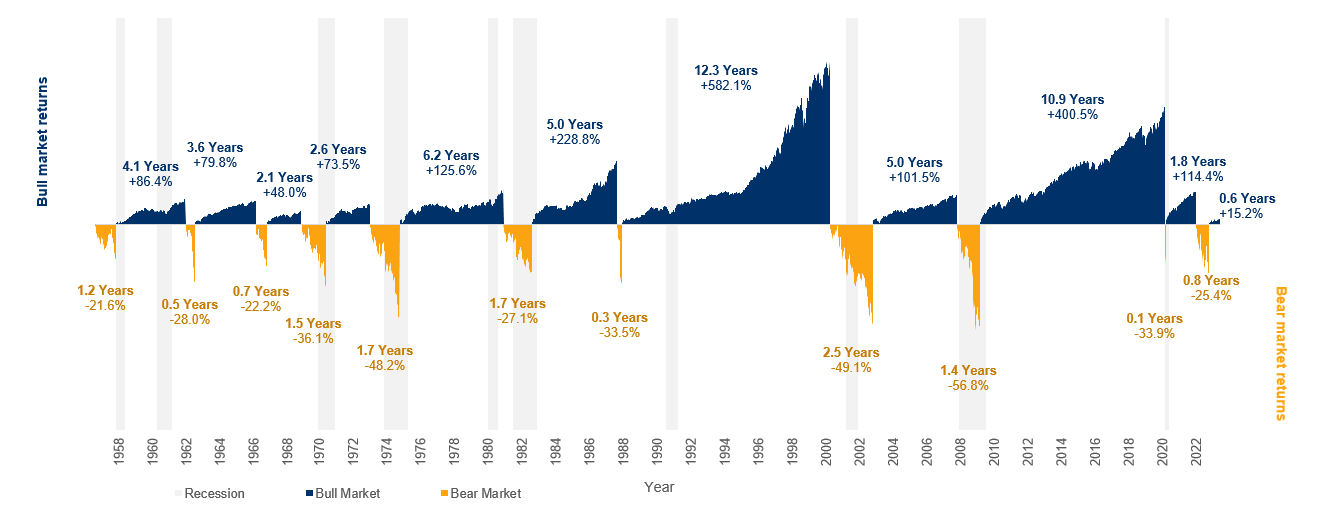
As of June 13, 2022. Reflects S&P 500 Index. Source: RBC GAM, Bloomberg. An investment cannot be made directly into an index. The graph does not reflect transaction costs, investment management fees or taxes. If such costs and fees were reflected, returns would be lower. Past performance is not a guarantee of future results. Bull market starts from lowest close reached after market has fallen 20% or more. Bear market starts from when the index closes at least 20% down from its previous high.
If you were to choose a spot to jump into markets, many investors would look at that chart and land on the logic of buying low – when securities are “on sale” – and riding through the expansion. Most wouldn't choose to get in at the top of the market, of course!
As the chart shows, U.S. equity markets saw 10 distinct bear market events over the past 70 years. According to RBC GAM, this suggests that, on average, long-term investors should expect to encounter a bear market roughly once every seven years.
When markets are choppy and investors feel uncertain about what to do (or not do), it can be helpful to remember the cyclical nature of markets that becomes clear in that historical view.
Watching the value of your investments fluctuate can be an emotional experience. According to RBC GAM , bear markets are a normal part of the long-term investment cycle – even if it may not feel like it in the moment. During these times, making dramatic changes to your investment portfolio may feel like a natural reaction. However, this can impact on your ability to reach your long-term goals.
On top of the cyclical tendency, the chart below shows that each time the market has dropped by a significant amount, the bounce back in the following year has also been significant. This pattern has repeated across bear markets since 1950.
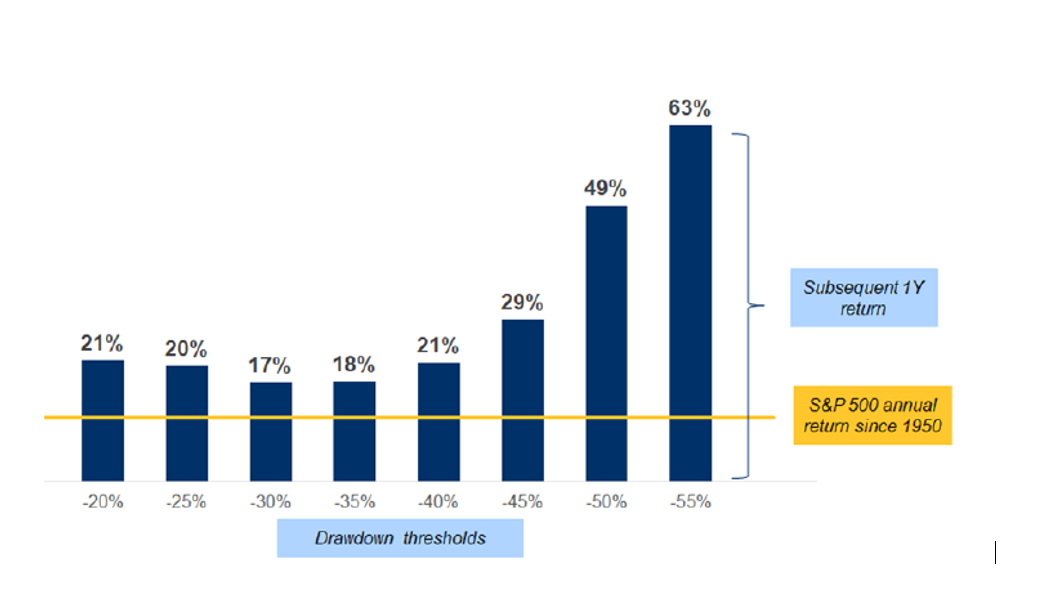
Source: RBC GAM, Bloomberg.S&P 500 TR (USD). Data reflects time period of January 1, 1950 to February 29, 2020. Subsequent 1-year return reflects the median 1-year return. An investment cannot be made directly into an index. The graph does not reflect transaction costs, investment management fees or taxes. If such costs and fees were reflected, returns would be lower. Past performance is not a guarantee of future results.
Unfortunately, we don't have an actual time machine and the future remains unknown. However, history has some powerful lessons that can help guide logical investing decisions over emotional ones. But still, a time machine would be fun, wouldn't it?
RBC Direct Investing Inc., RBC Global Asset Management Inc. and Royal Bank of Canada are separate corporate entities which are affiliated. RBC Direct Investing Inc. is a wholly owned subsidiary of Royal Bank of Canada and is a Member of the Investment Industry Regulatory Organization of Canada and the Canadian Investor Protection Fund. Royal Bank of Canada and certain of its issuers are related to RBC Direct Investing Inc. RBC Direct Investing Inc. does not provide investment advice or recommendations regarding the purchase or sale of any securities. Investors are responsible for their own investment decisions. RBC Direct Investing is a business name used by RBC Direct Investing Inc. ® / ™ Trademark(s) of Royal Bank of Canada. RBC and Royal Bank are registered trademarks of Royal Bank of Canada. Used under licence. © Royal Bank of Canada 2023.
Any information, opinions or views provided in this document, including hyperlinks to the RBC Direct Investing Inc. website or the websites of its affiliates or third parties, are for your general information only, and are not intended to provide legal, investment, financial, accounting, tax or other professional advice. While information presented is believed to be factual and current, its accuracy is not guaranteed and it should not be regarded as a complete analysis of the subjects discussed. All expressions of opinion reflect the judgment of the author(s) as of the date of publication and are subject to change. No endorsement of any third parties or their advice, opinions, information, products or services is expressly given or implied by RBC Direct Investing Inc. or its affiliates. You should consult with your advisor before taking any action based upon the information contained in this document.
Furthermore, the products, services and securities referred to in this publication are only available in Canada and other jurisdictions where they may be legally offered for sale. If you are not currently a resident of Canada, you should not access the information available on the RBC Direct Investing Inc. website.
Explore More

The Account That Could Help With Your Next Career Move
The Lifelong Learning Plan (LLP) could let you borrow from your retirement savings to pay for full-time education
minute read

5 Ways to Get More Out of Your RESP
How can you make the most of this investment vehicle? We explain.
minute read

There's an ETF for That!
Find out more about the options that are out there
minute read
Inspired Investor brings you personal stories, timely information and expert insights to empower your investment decisions. Visit About Us to find out more.